The collection of small, medium and large ELTs of Ecopneus in 2023
| Tipology of ELTs | Collected amounts in tonnes, as of 31st December 2023 |
| Small ELTs (< 33,25 kg) Such as those for Motorbikes, Scooters, Quads, MP3s, Enduros, Automobiles, SUVs, LCVs, Caravans |
146.045 |
| Medium ELTs (from 33,25 kg to 147,25 kg) Such as those for Trucks, Buses, Traction Units, Trailers |
38.392 |
| Large ELTs ( > 147,25 kg) Such as those for Industrial, agricultural, earthwork |
3.008 |
Watch also the data of large, medium and small ELT collection in 2022
The collection of small, medium and large ELTs of Ecopneus in 2022
| Tipology of ELTs | Collected amounts in tonnes, as of 31st December 2022 |
| Small ELTs (< 33,25 kg) Such as those for Motorbikes, Scooters, Quads, MP3s, Enduros, Automobiles, SUVs, LCVs, Caravans |
179.070 |
| Medium ELTs (from 33,25 kg to 147,25 kg) Such as those for Trucks, Buses, Traction Units, Trailers |
48.402 |
| Large ELTs ( > 147,25 kg) Such as those for Industrial, agricultural, earthwork |
4.367 |
Watch also the data of large, medium and small ELT collection in 2021
The collection of small, medium and large ELTs of Ecopneus in 2021
| Tipology of ELTs | Collected amounts in tonnes, as of 31st December 2021 |
| Small ELTs (< 33,25 kg) Such as those for Motorbikes, Scooters, Quads, MP3s, Enduros, Automobiles, SUVs, LCVs, Caravans |
154.558 |
| Medium ELTs (from 33,25 kg to 147,25 kg) Such as those for Trucks, Buses, Traction Units, Trailers |
42.566 |
| Large ELTs ( > 147,25 kg) Such as those for Industrial, agricultural, earthwork |
3.367 (yearly collection target: 3.229 tonnes) |
Watch also the data of large, medium and small ELT collection in 2020
The collection of small, medium and large ELTs of Ecopneus in 2020
| Tipology of ELTs | Collected amounts in tonnes, as of 31tst December 2020 |
| Small ELTs (from 0 kg to 10 kg) Motorbikes, Scooters, Quads, MP3s, Enduros, Automobiles, SUVs, LCVs, Caravans | 148.037 |
| Medium ELTs (from 11 kg to 109 kg) Trucks, Buses, Traction Units, Trailers | 36.502 |
| Large ELTs (from 110 kg to 750 kg) Industrial, agricultural, earthwork | 5.030 (yearly collection target: 6.500 tonnes) |
The management of the collection of small, medium and large ELTs
About 350,000 tonnes of tyres reach their end of life in Italy every year. They derive from the replacement of tyres of the circulating vehicles: the data highlight that about 30 million automobile tyres are placed on the spare parts market every year; moreover, another 2 million tyres for trucks, 3 million tyres of 2-wheeled vehicles, and over 300,000 tyres for the industrial and agricultural vehicles.
The latter represent a small quota compared to what is placed on the overall market: about 0.9%. However, by looking at the percentage in weight compared to the total, the quota goes up to over 4%. This is due to the large dimensions and subsequent weight of this typology of End-of-Life Tyres.
As it is easy to imagine, the characteristics of this typology of tyres require a high level of specialisation and technical equipment from the part of the companies that deal with tyre collection, transfer, and transport to treatment centres. They also require important management efforts to guarantee that all these End-of-Life tyres are correctly recovered all over Italy.
Finally, even the areas where large the End-of-Life Tyres are generated (farms, quarries, industrial sites) are usually located outside large urban centres or in places which cannot be easily reached. This makes their collection even more expensive and complex.
Also for these reasons, the effort of Ecopneus is even more important, as it guarantees ELT collection all over the national territory, small islands included, and their recovery and recycling from the part of the treatment companies part of the Ecopneus chain.
Number of ELTs collected during every intervention
Another useful indicator of the capillarity of the Ecopneus collection on the territory is the number of “pieces” collected during every ELT intervention carried out at spare parts operators’. The lower the number of ELTs per single collection, the more capillary the collection has been and has involved small spare parts centres located in remote places. Indeed, ELT collection carried out at small generation points (tyre dealers, service stations, mechanics etc.) is more expensive as it is less efficient compared to the interventions carried out at large tyre replacement centres (where it is possible to collect many more ELTs with a single collection). If we take into consideration “manual” interventions, that is, carried out without the help of dedicated containers, and that represent 94% of the overall collection of Ecopneus, we notice that in 58% of the collections carried out by Ecopneus in 2019 less that 200 “pieces” have been collected. This quota goes up to 75% if we consider also the collection activities with less than 300 pieces.
The collection is aligned with the expectations also in 2023.
Number of ELTs collected during every intervention in 2022 and 2023
| 2022 | 2023 (as of 31st December 2023) |
|||
| Number of pieces | Nr. collections | % | Nr. collections | % |
| ≤ 100 | 16.356 | 21% | 13.311 | 21% |
| from 101 to 200 | 24.104 | 32% | 19.546 | 31% |
| from 201 to 300 | 14.137 | 18% | 12.180 | 20% |
| more than 300 | 21.833 | 29% | 17.289 | 28% |
| TOTAL | 76.430 | 100% | 62.326 | 100% |
Relationship between withdrawal requests received and requests processed
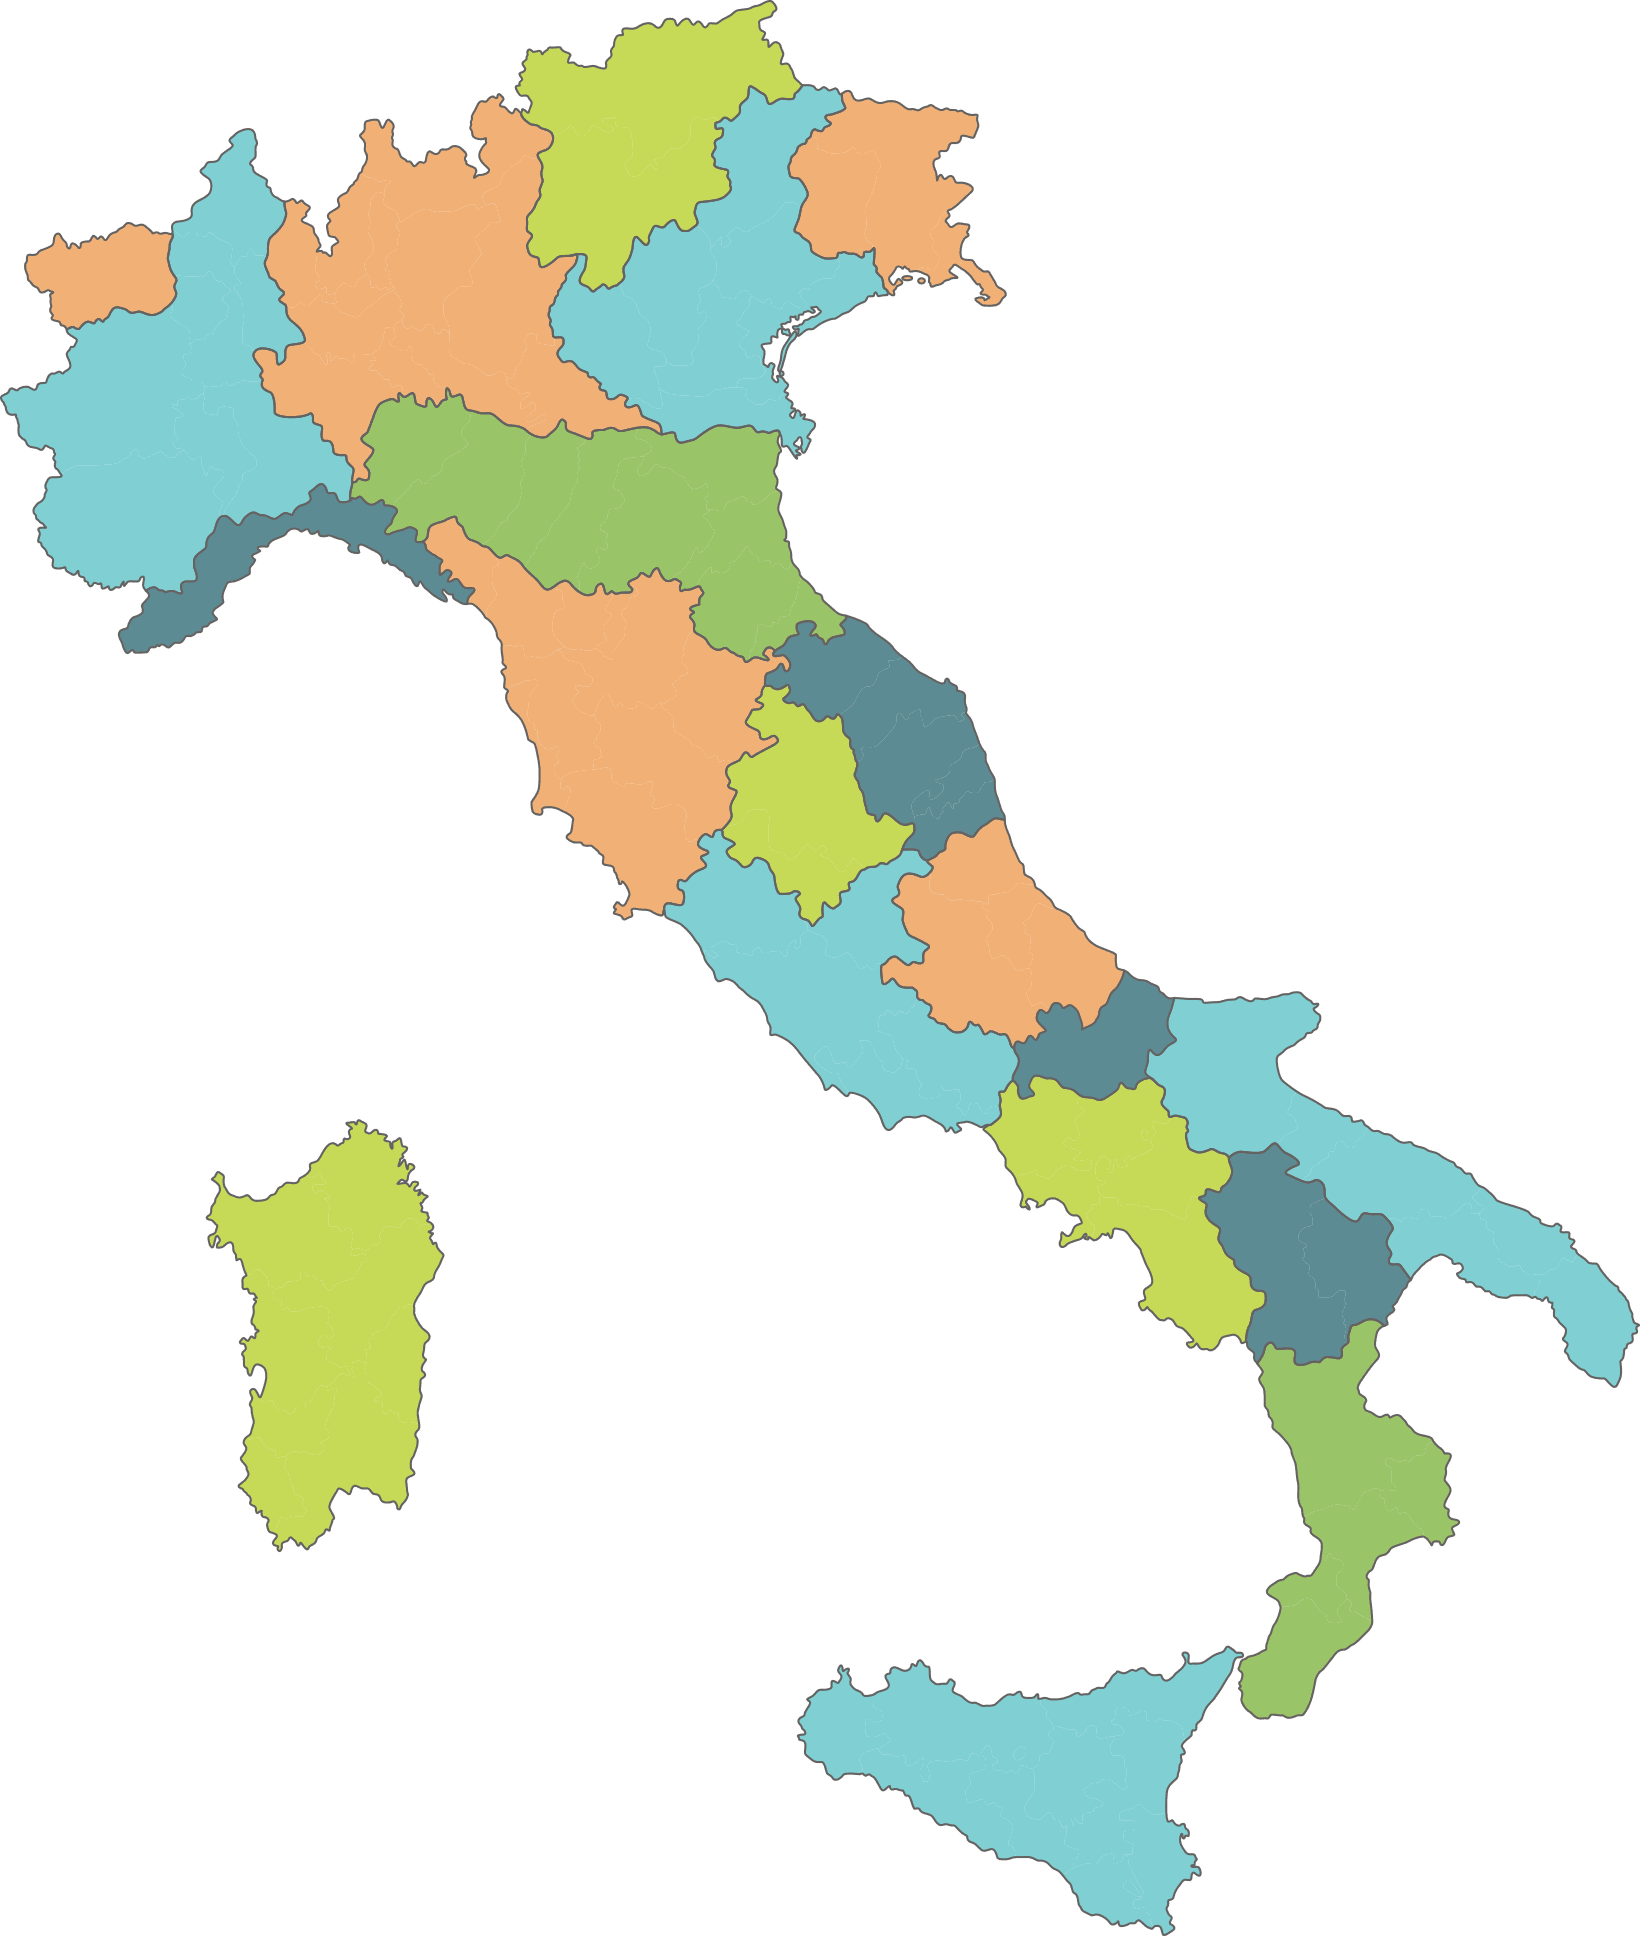
The map at the bottom of the page contains the data referring to the relationship between the ELT withdrawal requests entered into Ecopneus’ computer system by the spare parts operators (tyre dealers, service stations, garages) and the withdrawal requests processed by Ecopneus through its partner companies. Any deviations between the two values may be due to the way in which the ELT withdrawal requests are handled, as the withdrawal requests received may in some cases be handled in the following month. Visit also our page on the monthly trend of ELT collection to find out the data of Ecopneus’ ELT collection of ELTs month by month, for each Italian Region.
Relationship between withdrawal requests received and requests processed
The map at the bottom of the page contains the data referring to the relationship between the ELT withdrawal requests entered into Ecopneus’ computer system by the spare parts operators (tyre dealers, service stations, garages) and the withdrawal requests processed by Ecopneus through its partner companies. Any deviations between the two values may be due to the way in which the ELT withdrawal requests are handled, as the withdrawal requests received may in some cases be handled in the following month. Visit also our page on the monthly trend of ELT collection to find out the data of Ecopneus’ ELT collection of ELTs month by month, for each Italian Region.
Relationship between the collection requests entered into the Ecopneus IT system and processed collection requests
Data updated as of 31st December 2023
| Region | Collection requests entered | Processed collection requests | Relationship entered requests/ processed requests |
| Abruzzo | 1.746 | 1.628 | 93% |
| Basilicata | 650 | 510 | 78% |
| Calabria | 1.680 | 1.311 | 78% |
| Campania | 5.838 | 5.313 | 91% |
| Emilia-Romagna | 4.659 | 4.074 | 87% |
| Friuli-Venezia Giulia | 810 | 688 | 85% |
| Lazio | 8.873 | 8.536 | 96% |
| Liguria | 2.626 | 2.589 | 99% |
| Lombardia | 11.609 | 10.655 | 92% |
| Marche | 1.848 | 1.638 | 89% |
| Molise | 474 | 446 | 94% |
| Piemonte | 3.797 | 3.773 | 99% |
| Puglia | 4.633 | 4.203 | 91% |
| Sardegna | 1.651 | 1.415 | 86% |
| Sicilia | 8.658 | 8.314 | 96% |
| Toscana | 4.881 | 4.253 | 87% |
| Trentino-Alto Adige | 1.361 | 1.252 | 92% |
| Umbria | 600 | 559 | 93% |
| Valle d’Aosta | 66 | 68 | 103% |
| Veneto | 5.151 | 4.595 | 89% |
| TOTAL | 71.611 | 65.820 | 92% |
Find out more about the data referring to the collection requests received and processed in 2022
Relationship between the collection requests entered into the Ecopneus IT system and processed collection requests
Data updated as of 31st December 2022
| Region | Collection requests entered | Processed collection requests | Relationship entered requests/ processed requests |
| Abruzzo | 1.961 | 2.015 | 103% |
| Basilicata | 624 | 762 | 122% |
| Calabria | 2.038 | 2.209 | 108% |
| Campania | 7.199 | 7.335 | 102% |
| Emilia-Romagna | 5.685 | 5.796 | 102% |
| Friuli-Venezia Giulia | 935 | 1013 | 108% |
| Lazio | 10.335 | 10.211 | 99% |
| Liguria | 2.670 | 2.653 | 99% |
| Lombardia | 13.257 | 12.967 | 98% |
| Marche | 2.082 | 2.181 | 105% |
| Molise | 541 | 543 | 100% |
| Piemonte | 3.530 | 3.462 | 98% |
| Puglia | 5.587 | 5.779 | 103% |
| Sardegna | 2.078 | 2.242 | 108% |
| Sicilia | 7.946 | 7.976 | 100% |
| Toscana | 5.544 | 5.877 | 106% |
| Trentino-Alto Adige | 1.433 | 1.443 | 101% |
| Umbria | 704 | 694 | 99% |
| Valle d’Aosta | 81 | 81 | 100% |
| Veneto | 5.297 | 5.545 | 105% |
| TOTAL | 79.527 | 80.784 | 102% |
Find out more about the data referring to the collection requests received and processed in 2021
Relationship between the collection requests entered into the Ecopneus IT system and processed collection requests
Data updated as of 31st December 2021
| Region | Collection requests entered | Processed collection requests | Relationship entered requests/ processed requests |
| Abruzzo | 1.625 | 1.592 | 98% |
| Basilicata | 539 | 481 | 89% |
| Calabria | 1.919 | 1.766 | 92% |
| Campania | 5.933 | 6.089 | 103% |
| Emilia-Romagna | 5.017 | 4.947 | 99% |
| Friuli-Venezia Giulia | 1.025 | 884 | 86% |
| Lazio | 6.920 | 7.110 | 103% |
| Liguria | 2.510 | 2.491 | 99% |
| Lombardia | 12.760 | 12.393 | 97% |
| Marche | 2.226 | 2.108 | 95% |
| Molise | 457 | 468 | 102% |
| Piemonte | 4.348 | 4.300 | 99% |
| Puglia | 3.082 | 2.982 | 97% |
| Sardegna | 2.024 | 1.857 | 92% |
| Sicilia | 5.347 | 5.346 | 100% |
| Toscana | 4.462 | 4.528 | 101% |
| Trentino-Alto Adige | 1.434 | 1.142 | 80% |
| Umbria | 813 | 833 | 102% |
| Valle d’Aosta | 175 | 177 | 101% |
| Veneto | 4.869 | 4.268 | 88% |
| TOTAL | 67.485 | 65.762 | 97% |
Find out more about the data referring to the collection requests received and processed in 2020
Relationship between the collection requests entered into the Ecopneus IT system and processed collection requests
Data updated as of 31st December 2020
| Region | Collection requests entered | Processed collection requests | Relationship entered requests/ processed requests |
| Abruzzo | 1.624 | 1.527 | 94% |
| Basilicata | 589 | 474 | 80% |
| Calabria | 2.530 | 2.338 | 92% |
| Campania | 5.420 | 5.066 | 93% |
| Emilia-Romagna | 5.140 | 4.859 | 95% |
| Friuli-Venezia Giulia | 1.249 | 1.233 | 99% |
| Lazio | 7.382 | 6.921 | 94% |
| Liguria | 2.010 | 1.941 | 97% |
| Lombardia | 10.633 | 10.897 | 102% |
| Marche | 2.282 | 2.131 | 93% |
| Molise | 494 | 469 | 95% |
| Piemonte | 3.896 | 3.929 | 101% |
| Puglia | 3.780 | 3.463 | 92% |
| Sardegna | 2.232 | 2.065 | 93% |
| Sicilia | 6.441 | 6.330 | 98% |
| Toscana | 4.758 | 4.236 | 89% |
| Trentino-Alto Adige | 1.599 | 1.581 | 99% |
| Umbria | 842 | 694 | 82% |
| Valle d’Aosta | 244 | 244 | 100% |
| Veneto | 5.709 | 5.676 | 99% |
| TOTAL | 68.854 | 66.074 | 96% |
Abruzzo
Rapporto tra richieste di prelievo ricevute e richieste evase: 92%
Richieste di prelievo ricevute: 1.481
Richieste di prelievo evase: 1.365
Dati aggiornati al 31 ottobre 2023
Basilicata
Rapporto tra richieste di prelievo ricevute e richieste evase: 82%
Richieste di prelievo ricevute: 550
Richieste di prelievo evase: 452
Dati aggiornati al 31 ottobre 2023
Calabria
Rapporto tra richieste di prelievo ricevute e richieste evase: 75%
Richieste di prelievo ricevute: 1.513
Richieste di prelievo evase: 1.136
Dati aggiornati al 31 ottobre 2023
Campania
Rapporto tra richieste di prelievo ricevute e richieste evase: 90%
Richieste di prelievo ricevute: 5.065
Richieste di prelievo evase: 4.573
Dati aggiornati al 31 ottobre 2023
Emilia-Romagna
Rapporto tra richieste di prelievo ricevute e richieste evase :89%
Richieste di prelievo ricevute: 3.975
Richieste di prelievo evase: 3.539
Dati aggiornati al 31 ottobre 2023
Friuli-Venezia Giulia
Rapporto tra richieste di prelievo ricevute e richieste evase: 90%
Richieste di prelievo ricevute: 683
Richieste di prelievo evase: 613
Dati aggiornati al 31 ottobre 2023
Lazio
Rapporto tra richieste di prelievo ricevute e richieste evase: 95%
Richieste di prelievo ricevute: 7.820
Richieste di prelievo evase: 7.458
Dati aggiornati al 31 ottobre 2023
Liguria
Rapporto tra richieste di prelievo ricevute e richieste evase: 100%
Richieste di prelievo ricevute: 2.280
Richieste di prelievo evase: 2.290
Dati aggiornati al 31 ottobre 2023
Lombardia
Rapporto tra richieste di prelievo ricevute e richieste evase: 93%
Richieste di prelievo ricevute: 10.023
Richieste di prelievo evase: 9.341
Dati aggiornati al 31 ottobre 2023
Marche
Rapporto tra richieste di prelievo ricevute e richieste evase: 91%
Richieste di prelievo ricevute: 1.540
Richieste di prelievo evase: 1.407
Dati aggiornati al 31 ottobre 2023
Molise
Rapporto tra richieste di prelievo ricevute e richieste evase: 97%
Richieste di prelievo ricevute: 387
Richieste di prelievo evase: 375
Dati aggiornati al 31 ottobre 2023
Piemonte
Rapporto tra richieste di prelievo ricevute e richieste evase: 99%
Richieste di prelievo ricevute: 3.135
Richieste di prelievo evase: 3.112
Dati aggiornati al 31 ottobre 2023
Puglia
Rapporto tra richieste di prelievo ricevute e richieste evase: 89%
Richieste di prelievo ricevute: 4-078
Richieste di prelievo evase: 3.643
Dati aggiornati al 31 ottobre 2023
Sardegna
Rapporto tra richieste di prelievo ricevute e richieste evase: 83%
Richieste di prelievo ricevute: 1.443
Richieste di prelievo evase: 1.192
Dati aggiornati al 31 ottobre 2023
Sicilia
Rapporto tra richieste di prelievo ricevute e richieste evase: 95%
Richieste di prelievo ricevute: 7.565
Richieste di prelievo evase: 7.209
Dati aggiornati al 31 ottobre 2023
Toscana
Rapporto tra richieste di prelievo ricevute e richieste evase: 88%
Richieste di prelievo ricevute: 4.232
Richieste di prelievo evase: 3.728
Dati aggiornati al 31 ottobre 2023
Trentino-Alto Adige
Rapporto tra richieste di prelievo ricevute e richieste evase: 101%
Richieste di prelievo ricevute: 1.099
Richieste di prelievo evase: 1.108
Dati aggiornati al 31 ottobre 2023
Umbria
Rapporto tra richieste di prelievo ricevute e richieste evase: 103%
Richieste di prelievo ricevute: 500
Richieste di prelievo evase: 515
Dati aggiornati al 31 ottobre 2023
Valle d’Aosta
Rapporto tra richieste di prelievo ricevute e richieste evase: 106%
Richieste di prelievo ricevute: 49
Richieste di prelievo evase: 52
Dati aggiornati al 31 ottobre 2023
Veneto
Rapporto tra richieste di prelievo ricevute e richieste evase: 91%
Richieste di prelievo ricevute: 4.338
Richieste di prelievo evase: 3.930
Dati aggiornati al 31 ottobre 2023
 Collect ELT