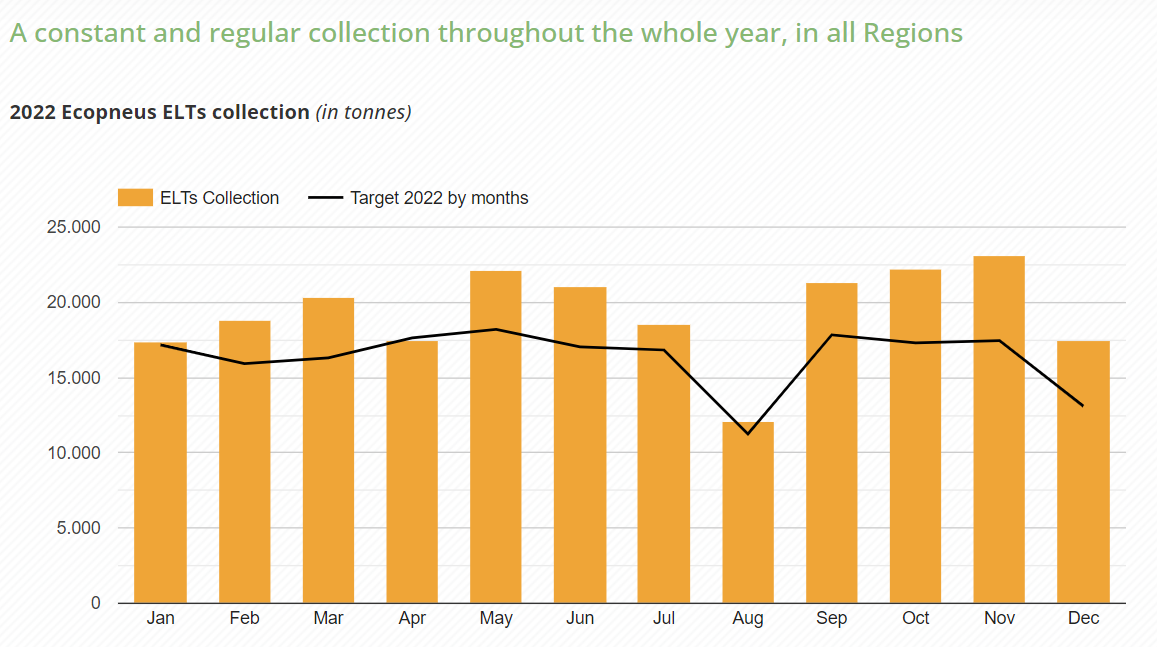
A constant and regular collection throughout the whole year, in all Regions
Watch also the 2022 ELT collection chart
Monthly collection results of 2022
Watch also the 2021 ELT collection chart
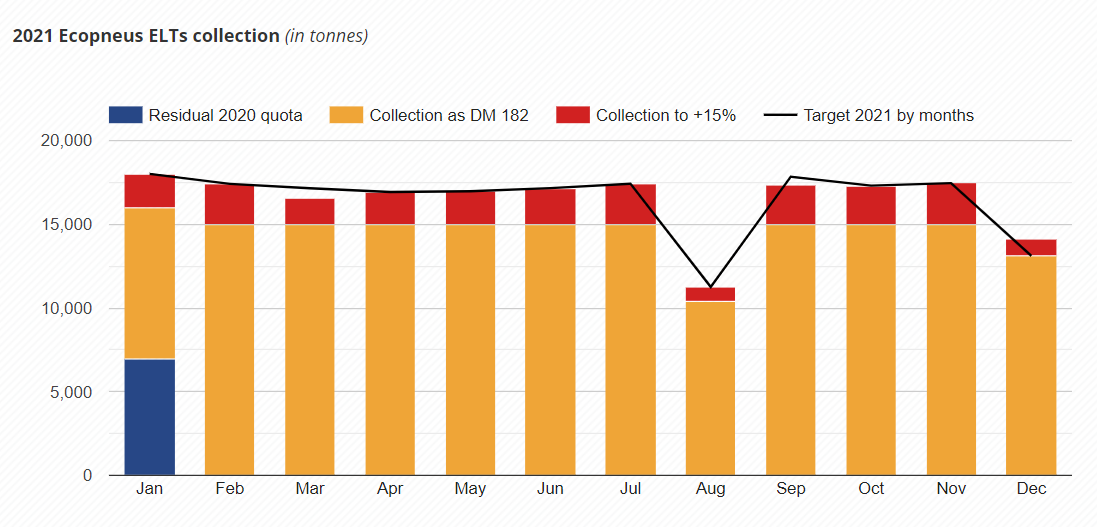
Monthly collection results of 2021
Watch also the 2020 ELT collection chart
Monthly collection results of 2020
The collection of End-of-Life Tyres managed by Ecopneus is based on a careful monthly planning, aimed at the reaching of the annual collection target provided for by the legislation . It is also functional for complying with the normal seasonal fluctuations of the operators’ requests of ELT collection. Indeed, these are linked to the changing of tyres which, for example, reach a peak in springtime and autumn due to the changing of winter/summer tyres.
As per art. 228 of the Legislative Decree 152/2006, tyre producers and importers have to provide – either individually or in an associated form such as Ecopneus is – for the management of an amount of ELTs equal to the one they place on the spare parts market during the previous year. This follows the principle of the Extended Producer’s Responsibility – an organizational model adopted by the majority of the European Countries.
The mission of Ecopneus is to guarantee the tracking and recovery of about 200,000 tonnes of End-of-Life Tyres every year.
Cumulative trend of ELT collection month by month in 2023 (in tonnes)
Thanks to careful planning and up-stream identification of the operative collection targets on a monthly basis, Ecopneus can concentrate on the collection of End-of-Life Tyres in those months of the year characterised by greater collection requests. This allows to better comply with the requests of the spare parts market operators (tyre dealers, service stations, mechanics) and supplying them with a constant service all over the Italian territory (small islands included) during the course of the whole year.
Watch also the chart with the cumulative trend of the Ecopneus collection in 2022
Cumulative trend of ELT collection month by month in 2022 (in tonnes)
Watch also the chart with the cumulative trend of the Ecopneus collection in 2021
Cumulative trend of ELT collection month by month in 2021 (in tonnes)
Watch also the chart with the cumulative trend of the Ecopneus collection in 2020
Cumulative trend of ELT collection month by month in 2020 (in tonnes)
Ecopneus ELT collection trend in 2023
| Year 2022 | Collection Operative Target (in tonnes) | ELT collection (in tonnes) |
| January | 14.890 | 19.378 |
| February | 14.890 | 18.178 |
| March | 14.890 | 16.888 |
| April | 15.308 | 15.323 |
| May | 14.890 | 17.872 |
| June | 14.890 | 17.031 |
| July | 14.890 | 17.141 |
| August | 1.900 | 4.365 |
| September | 15.388 | 15.357 |
| October | 15.388 | 16.546 |
| November | 15.388 | 16.744 |
| December | 15.387 | 12.633 |
| TOTAL | 168.096 | 187.456 |
| LEGAL TARGET | 168.096 | |
| RELATIONSHIP LEGAL TARGET/ ECOPNEUS COLLECTION (as of 31st December 2023) | 112% |
Watch also the 2022 ELT collection chart
Ecopneus ELT collection trend in 2022
| Year 2020 | Collection Operative Target (in tonnes) | ELT collection (in tonnes) |
| January | 17.347 | 17.175 |
| February | 15.927 | 18.828 |
| March | 16.312 | 20.313 |
| April | 17.646 | 17.435 |
| May | 18.202 | 22.111 |
| June | 17.047 | 21.058 |
| July | 16.833 | 18.571 |
| August | 10.564 | 12.129 |
| September | 16.662 | 21.367 |
| October | 18.168 | 22.129 |
| November | 18.253 | 23.119 |
| December | 13.771 | 17.492 |
| TOTAL | 196.732 | 231.727 |
| LEGAL TARGET | 196.732 | |
| RELATIONSHIP LEGAL TARGET/ ECOPNEUS COLLECTION (as of 31st December 2022) | 119% |
Watch also the 2021 ELT collection chart
Ecopneus ELT collection trend in 2021
| Year 2020 | Collection Operative Target (in tonnes) | ELT collection (in tonnes) |
| January | 17.780 | 18.013 |
| February | 17.580 | 17.412 |
| March | 17.150 | 16.592 |
| April | 16.930 | 17.708 |
| May | 16.974 | 17.941 |
| June | 17.160 | 17.036 |
| July | 17.420 | 17.461 |
| August | 11.250 | 10.466 |
| September | 17.380 | 18.147 |
| October | 17.310 | 18.256 |
| November | 17.459 | 20.811 |
| December | 13.109 | 10.662 |
| TOTAL | 197.502 | 200.491 |
| LEGAL TARGET | 197.567 | |
| RELATIONSHIP LEGAL TARGET/ ECOPNEUS COLLECTION (as of 31st December 2021) | 101% |
Watch also the 2020 ELT collection chart
Ecopneus ELT collection trend in 2020
| Year 2020 | Collection Operative Target (in tonnes) | ELT collection (in tonnes) |
| January | 15.630 | 17.646 |
| February | 17.930 | 17.441 |
| March | 18.380 | 18.459 |
| April | 18.200 | 14.584 |
| May | 17950 | 15.119 |
| June | 18.200 | 13.646 |
| July | 18.960 | 14.052 |
| August | 8.430 | 3.448 |
| September | 18.880 | 21.347 |
| October | 18.680 | 22.023 |
| November | 18.930 | 19.279 |
| December | 10.830 | 12.525 |
| TOTAL | 201.000 | 189.569 |
| LEGAL TARGET | 201.000 | |
| RELATIONSHIP LEGAL TARGET/ ECOPNEUS COLLECTION (as of 31st December 2020) | 94% |
ELT collection Region by Region
The map and table here below contain the data of ELT collection for every single Region. They indicate a substantial homogeneity in the collection of ELTs carried out by Ecopneus all over the national territory. By clicking on a Region, it is possible to visualise the data related to the Ecopneus collection.
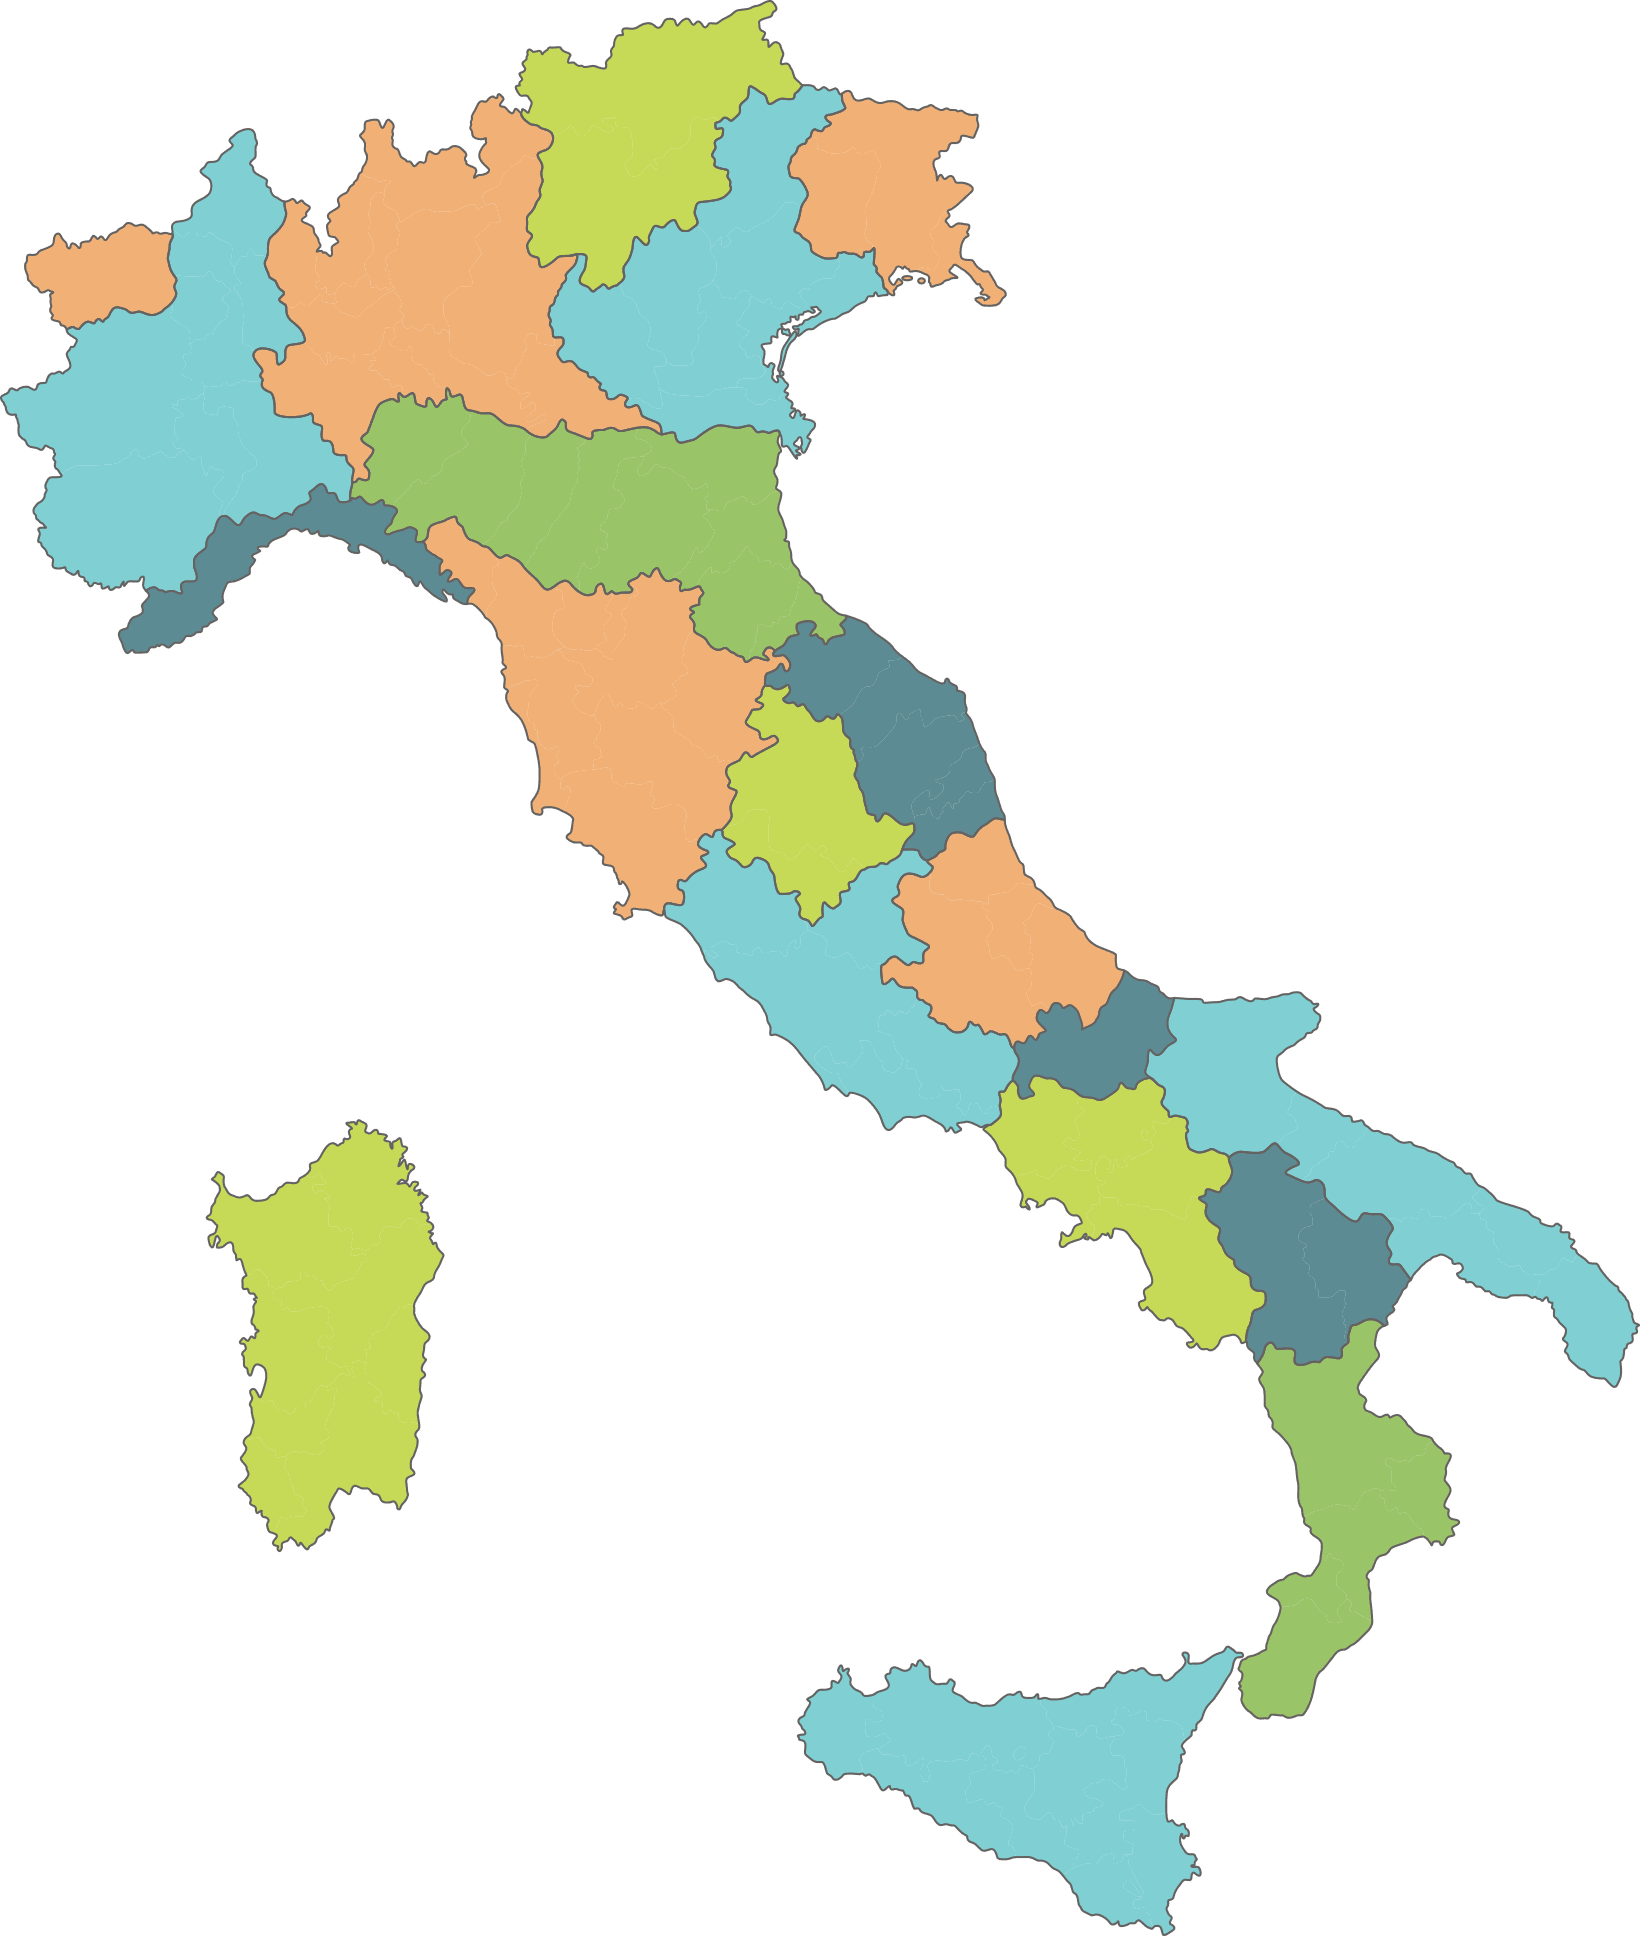
ELTs collection region by region
| Region | ELTs collection 2022 (in tonnes) |
ELTs collection 2023 (in tonnes, as of 31st December 2023) |
| Abruzzo | 5.917 | 4.398 |
| Basilicata | 3.211 | 1.828 |
| Calabria | 10.132 | 5.803 |
| Campania | 20.417 | 16.205 |
| Emilia-Romagna | 20.391 | 15.294 |
| Friuli-Venezia Giulia | 3.257 | 2.135 |
| Lazio | 18.797 | 17.074 |
| Liguria | 4.590 | 4.915 |
| Lombardia | 33.883 | 29.941 |
| Marche | 7.714 | 6.252 |
| Molise | 1.590 | 1.358 |
| Piemonte | 10.025 | 11.176 |
| Puglia | 16.465 | 12.127 |
| Sardegna | 10.160 | 5.882 |
| Sicilia | 16.631 | 14.443 |
| Toscana | 15.816 | 11.984 |
| Trentino-Alto Adige | 7.819 | 5.957 |
| Umbria | 2.565 | 1.758 |
| Valle d’Aosta | 145 | 151 |
| Veneto | 22.201 | 18.775 |
| TOTAL | 231.727 | 187.456 |
| LEGAL TARGET | 197.567 | 168.096 |
Abruzzo
Raccolta PFU di Ecopneus nel 2023: 3.686 tonnellate
Dato aggiornato al 31 ottobre 2023
Basilicata
Raccolta PFU di Ecopneus nel 2023: 1.569 tonnellate
Dato aggiornato al 31 ottobre 2023
Calabria
Raccolta PFU di Ecopneus nel 2023: 4.850 tonnellate
Dato aggiornato al 31 ottobre 2023
Campania
Raccolta PFU di Ecopneus nel 2023: 13.623 tonnellate
Dato aggiornato al 31 ottobre 2023
Emilia-Romagna
Raccolta PFU di Ecopneus nel 2023: 12.818 tonnellate
Dato aggiornato al 31 ottobre 2023
Friuli-Venezia Giulia
Raccolta PFU di Ecopneus nel 2023: 1.939 tonnellate
Dato aggiornato al 31 ottobre 2023
Lazio
Raccolta PFU di Ecopneus nel 2023: 14.315 tonnellate
Dato aggiornato al 31 ottobre 2023
Liguria
Raccolta PFU di Ecopneus nel 2023: 4.212 tonnellate
Dato aggiornato al 31 ottobre 2023
Lombardia
Raccolta PFU di Ecopneus nel 2023: 25.586 tonnellate
Dato aggiornato al 31 ottobre 2023
Marche
Raccolta PFU di Ecopneus nel 2023: 5.070 tonnellate
Dato aggiornato al 31 ottobre 2023
Molise
Raccolta PFU di Ecopneus nel 2023: 1.130 tonnellate
Dato aggiornato al 31 ottobre 2023
Piemonte
Raccolta PFU di Ecopneus nel 2023: 9.218 tonnellate
Dato aggiornato al 31 ottobre 2023
Puglia
Raccolta PFU di Ecopneus nel 2023: 10.230 tonnellate
Dato aggiornato al 31 ottobre 2023
Sardegna
Raccolta PFU di Ecopneus nel 2023: 4.825 tonnellate
Dato aggiornato al 31 ottobre 2023
Sicilia
Raccolta PFU di Ecopneus nel 2023: 12.253 tonnellate
Dato aggiornato al 31 ottobre 2023
Toscana
Raccolta PFU di Ecopneus nel 2023: 10.247 tonnellate
Dato aggiornato al 31 ottobre 2023
Trentino-Alto Adige
Raccolta PFU di Ecopneus nel 2023: 5.060 tonnellate
Dato aggiornato al 31 ottobre 2023
Umbria
Raccolta PFU di Ecopneus nel 2023: 1.549 tonnellate
Dato aggiornato al 31 ottobre 2023
Valle d’Aosta
Raccolta PFU di Ecopneus nel 2023: 110 tonnellate
Dato aggiornato al 31 ottobre 2023
Veneto
Raccolta PFU di Ecopneus nel 2023: 15.789 tonnellate
Dato aggiornato al 31 ottobre 2023
 Collect ELT