The collection of small, medium and large ELTs of Ecopneus in 2024
| Tipology of ELTs | Collected amounts in tonnes, as of 30th April 2024 |
| Small ELTs (< 33,25 kg) Such as those for Motorbikes, Scooters, Quads, MP3s, Enduros, Automobiles, SUVs, LCVs, Caravans |
11.070 |
| Medium ELTs (from 33,25 kg to 147,25 kg) Such as those for Trucks, Buses, Traction Units, Trailers |
3.087 |
| Large ELTs ( > 147,25 kg) Such as those for Industrial, agricultural, earthwork |
262 |
Watch also the data of large, medium and small ELT collection in 2023
The collection of small, medium and large ELTs of Ecopneus in 2023
| Tipology of ELTs | Collected amounts in tonnes, as of 31st December 2023 |
| Small ELTs (< 33,25 kg) Such as those for Motorbikes, Scooters, Quads, MP3s, Enduros, Automobiles, SUVs, LCVs, Caravans |
146.045 |
| Medium ELTs (from 33,25 kg to 147,25 kg) Such as those for Trucks, Buses, Traction Units, Trailers |
38.392 |
| Large ELTs ( > 147,25 kg) Such as those for Industrial, agricultural, earthwork |
3.008 |
Watch also the data of large, medium and small ELT collection in 2022
The collection of small, medium and large ELTs of Ecopneus in 2022
| Tipology of ELTs | Collected amounts in tonnes, as of 31st December 2022 |
| Small ELTs (< 33,25 kg) Such as those for Motorbikes, Scooters, Quads, MP3s, Enduros, Automobiles, SUVs, LCVs, Caravans |
179.070 |
| Medium ELTs (from 33,25 kg to 147,25 kg) Such as those for Trucks, Buses, Traction Units, Trailers |
48.402 |
| Large ELTs ( > 147,25 kg) Such as those for Industrial, agricultural, earthwork |
4.367 |
Watch also the data of large, medium and small ELT collection in 2021
The collection of small, medium and large ELTs of Ecopneus in 2021
| Tipology of ELTs | Collected amounts in tonnes, as of 31st December 2021 |
| Small ELTs (< 33,25 kg) Such as those for Motorbikes, Scooters, Quads, MP3s, Enduros, Automobiles, SUVs, LCVs, Caravans |
154.558 |
| Medium ELTs (from 33,25 kg to 147,25 kg) Such as those for Trucks, Buses, Traction Units, Trailers |
42.566 |
| Large ELTs ( > 147,25 kg) Such as those for Industrial, agricultural, earthwork |
3.367 (yearly collection target: 3.229 tonnes) |
The management of the collection of small, medium and large ELTs
About 350,000 tonnes of tyres reach their end of life in Italy every year. They derive from the replacement of tyres of the circulating vehicles: the data highlight that about 30 million automobile tyres are placed on the spare parts market every year; moreover, another 2 million tyres for trucks, 3 million tyres of 2-wheeled vehicles, and over 300,000 tyres for the industrial and agricultural vehicles.
The latter represent a small quota compared to what is placed on the overall market: about 0.9%. However, by looking at the percentage in weight compared to the total, the quota goes up to over 4%. This is due to the large dimensions and subsequent weight of this typology of End-of-Life Tyres.
As it is easy to imagine, the characteristics of this typology of tyres require a high level of specialisation and technical equipment from the part of the companies that deal with tyre collection, transfer, and transport to treatment centres. They also require important management efforts to guarantee that all these End-of-Life tyres are correctly recovered all over Italy.
Finally, even the areas where large the End-of-Life Tyres are generated (farms, quarries, industrial sites) are usually located outside large urban centres or in places which cannot be easily reached. This makes their collection even more expensive and complex.
Also for these reasons, the effort of Ecopneus is even more important, as it guarantees ELT collection all over the national territory, small islands included, and their recovery and recycling from the part of the treatment companies part of the Ecopneus chain.
Relationship between withdrawal requests received and requests processed
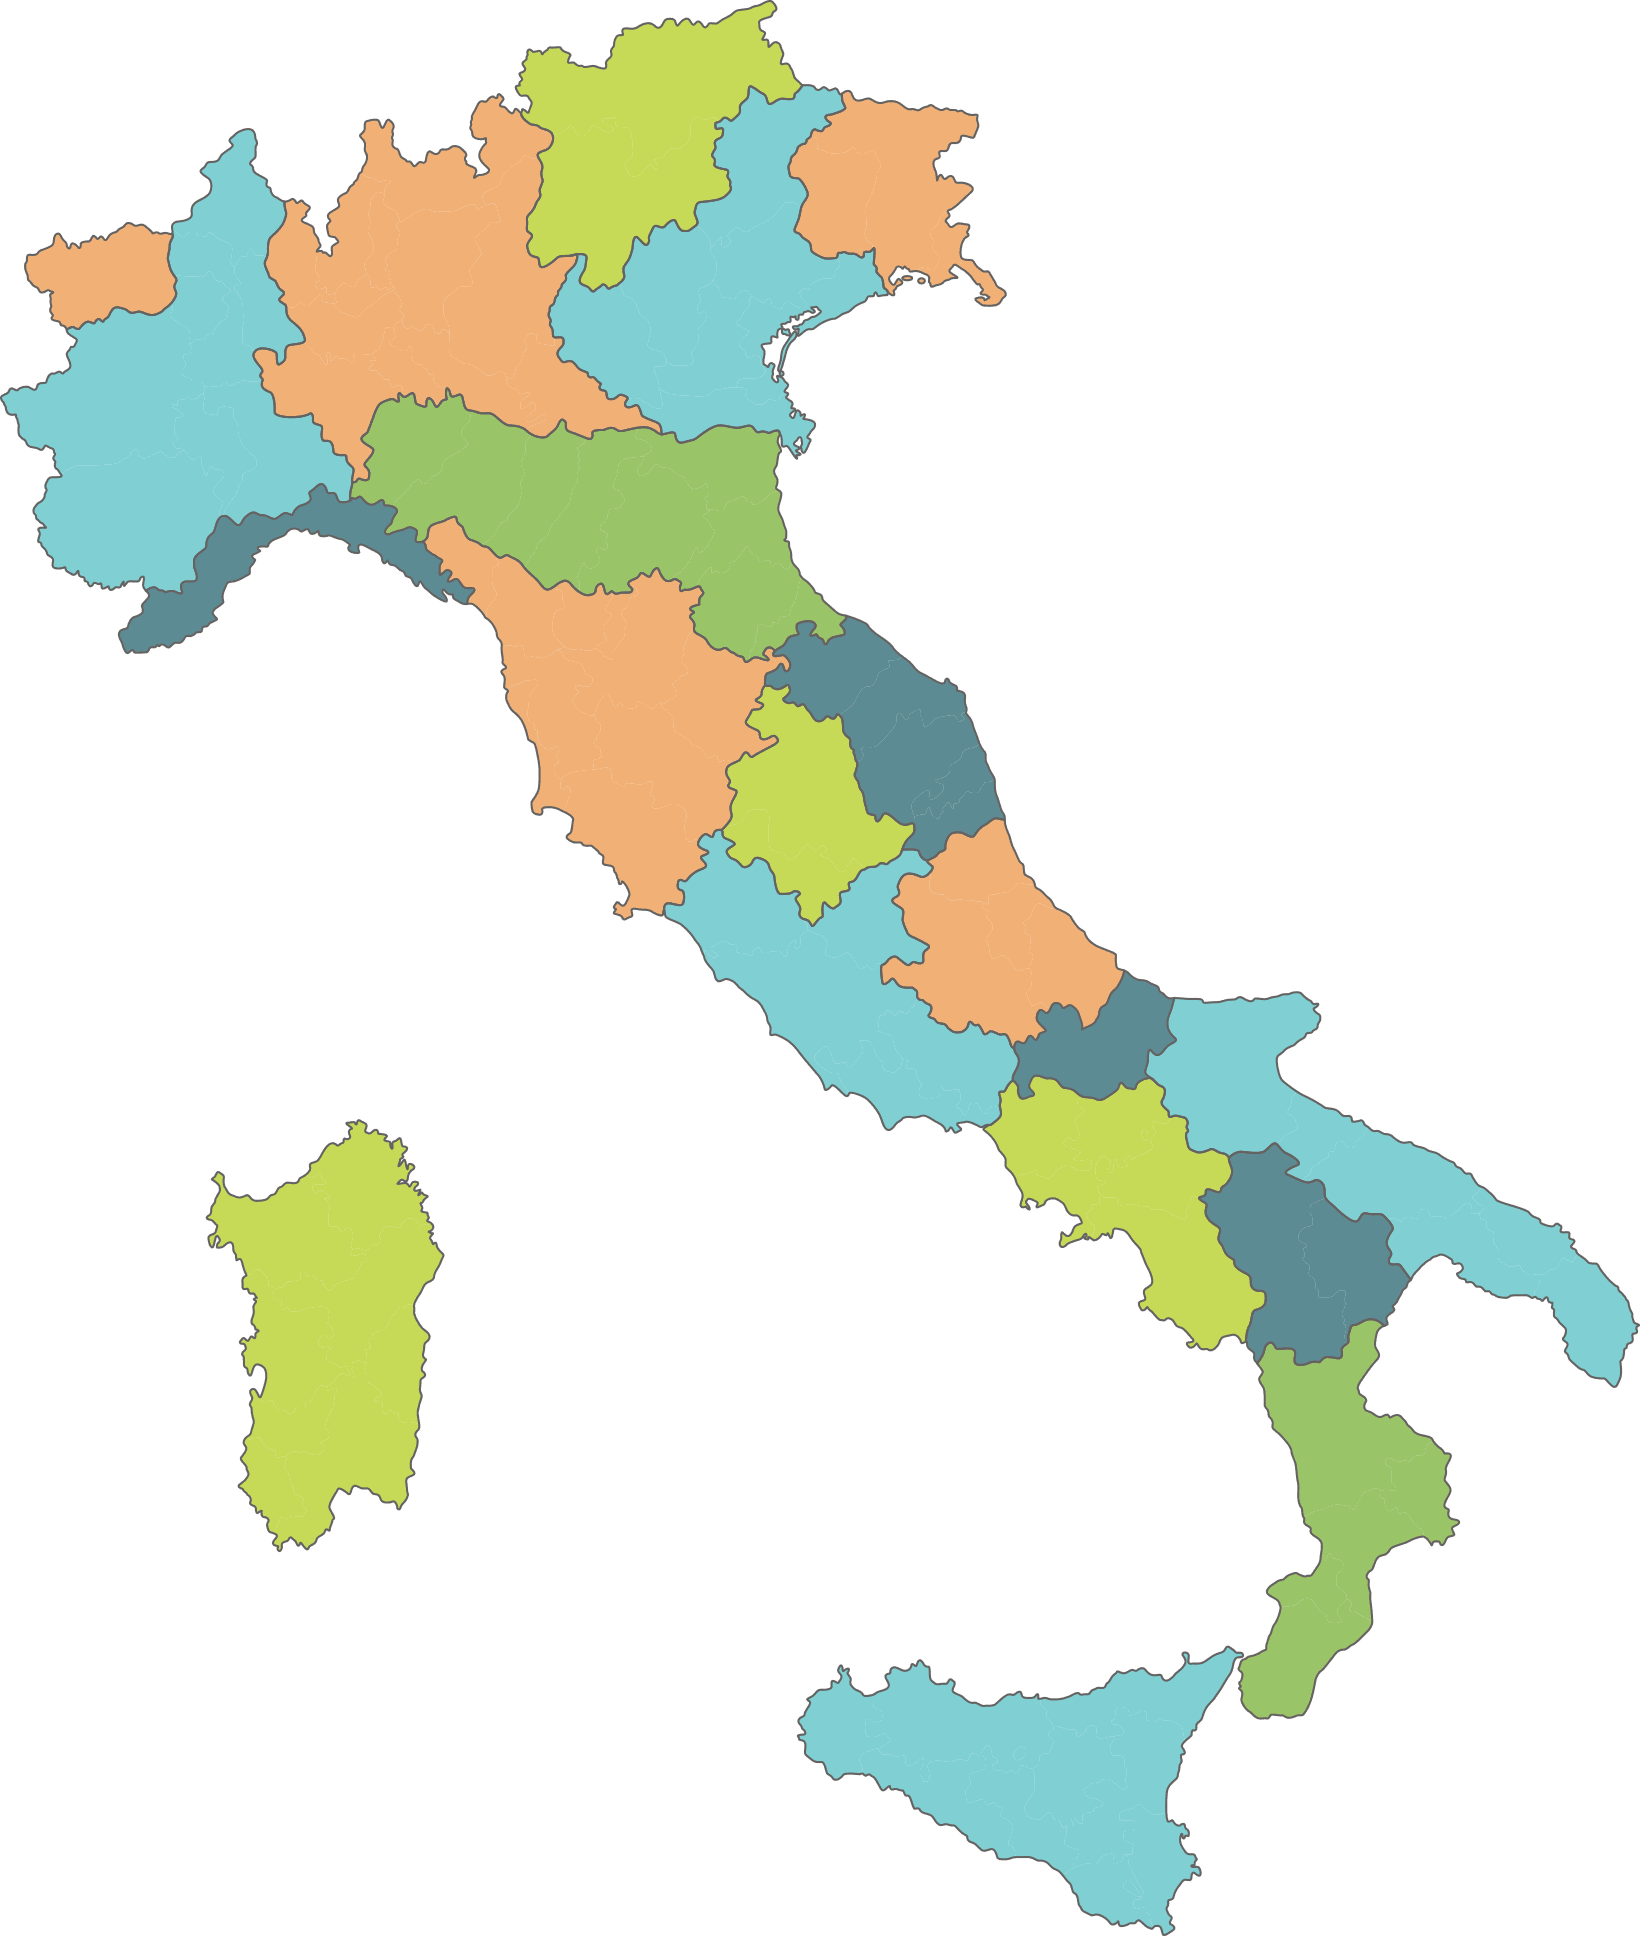
The map at the bottom of the page contains the data referring to the relationship between the ELT withdrawal requests entered into Ecopneus’ computer system by the spare parts operators (tyre dealers, service stations, garages) and the withdrawal requests processed by Ecopneus through its partner companies. Any deviations between the two values may be due to the way in which the ELT withdrawal requests are handled, as the withdrawal requests received may in some cases be handled in the following month. Visit also our page on the monthly trend of ELT collection to find out the data of Ecopneus’ ELT collection of ELTs month by month, for each Italian Region.
Relationship between the collection requests entered into the Ecopneus IT system and processed collection requests
Data updated as of 30th April 2024
| Region | Collection requests entered | Processed collection requests | Relationship entered requests/ processed requests |
| Abruzzo | 493 | 383 | 78% |
| Basilicata | 152 | 86 | 57% |
| Calabria | 355 | 243 | 68% |
| Campania | 1.423 | 1.371 | 96% |
| Emilia-Romagna | 1.152 | 994 | 86% |
| Friuli-Venezia Giulia | 209 | 179 | 86% |
| Lazio | 2.296 | 2.141 | 93% |
| Liguria | 735 | 738 | 100% |
| Lombardia | 2.693 | 2.451 | 91% |
| Marche | 510 | 430 | 84% |
| Molise | 119 | 116 | 97% |
| Piemonte | 1.215 | 1.289 | 106% |
| Puglia | 961 | 863 | 90% |
| Sardegna | 424 | 333 | 79% |
| Sicilia | 2.275 | 2.172 | 95% |
| Toscana | 1.226 | 1.074 | 88% |
| Trentino-Alto Adige | 316 | 241 | 76% |
| Umbria | 179 | 157 | 88% |
| Valle d’Aosta | 20 | 23 | 115% |
| Veneto | 1.447 | 1.091 | 75% |
| TOTAL | 18.200 | 16.375 | 90% |
Find out more about the data referring to the collection requests received and processed in 2023
Relationship between the collection requests entered into the Ecopneus IT system and processed collection requests
Data updated as of 31st December 2023
| Region | Collection requests entered | Processed collection requests | Relationship entered requests/ processed requests |
| Abruzzo | 1.746 | 1.628 | 93% |
| Basilicata | 650 | 510 | 78% |
| Calabria | 1.680 | 1.311 | 78% |
| Campania | 5.838 | 5.313 | 91% |
| Emilia-Romagna | 4.659 | 4.074 | 87% |
| Friuli-Venezia Giulia | 810 | 688 | 85% |
| Lazio | 8.873 | 8.536 | 96% |
| Liguria | 2.626 | 2.589 | 99% |
| Lombardia | 11.609 | 10.655 | 92% |
| Marche | 1.848 | 1.638 | 89% |
| Molise | 474 | 446 | 94% |
| Piemonte | 3.797 | 3.773 | 99% |
| Puglia | 4.633 | 4.203 | 91% |
| Sardegna | 1.651 | 1.415 | 86% |
| Sicilia | 8.658 | 8.314 | 96% |
| Toscana | 4.881 | 4.253 | 87% |
| Trentino-Alto Adige | 1.361 | 1.252 | 92% |
| Umbria | 600 | 559 | 93% |
| Valle d’Aosta | 66 | 68 | 103% |
| Veneto | 5.151 | 4.595 | 89% |
| TOTAL | 71.611 | 65.820 | 92% |
Find out more about the data referring to the collection requests received and processed in 2022
Relationship between the collection requests entered into the Ecopneus IT system and processed collection requests
Data updated as of 31st December 2022
| Region | Collection requests entered | Processed collection requests | Relationship entered requests/ processed requests |
| Abruzzo | 1.961 | 2.015 | 103% |
| Basilicata | 624 | 762 | 122% |
| Calabria | 2.038 | 2.209 | 108% |
| Campania | 7.199 | 7.335 | 102% |
| Emilia-Romagna | 5.685 | 5.796 | 102% |
| Friuli-Venezia Giulia | 935 | 1013 | 108% |
| Lazio | 10.335 | 10.211 | 99% |
| Liguria | 2.670 | 2.653 | 99% |
| Lombardia | 13.257 | 12.967 | 98% |
| Marche | 2.082 | 2.181 | 105% |
| Molise | 541 | 543 | 100% |
| Piemonte | 3.530 | 3.462 | 98% |
| Puglia | 5.587 | 5.779 | 103% |
| Sardegna | 2.078 | 2.242 | 108% |
| Sicilia | 7.946 | 7.976 | 100% |
| Toscana | 5.544 | 5.877 | 106% |
| Trentino-Alto Adige | 1.433 | 1.443 | 101% |
| Umbria | 704 | 694 | 99% |
| Valle d’Aosta | 81 | 81 | 100% |
| Veneto | 5.297 | 5.545 | 105% |
| TOTAL | 79.527 | 80.784 | 102% |
Find out more about the data referring to the collection requests received and processed in 2021
Relationship between the collection requests entered into the Ecopneus IT system and processed collection requests
Data updated as of 31st December 2021
| Region | Collection requests entered | Processed collection requests | Relationship entered requests/ processed requests |
| Abruzzo | 1.625 | 1.592 | 98% |
| Basilicata | 539 | 481 | 89% |
| Calabria | 1.919 | 1.766 | 92% |
| Campania | 5.933 | 6.089 | 103% |
| Emilia-Romagna | 5.017 | 4.947 | 99% |
| Friuli-Venezia Giulia | 1.025 | 884 | 86% |
| Lazio | 6.920 | 7.110 | 103% |
| Liguria | 2.510 | 2.491 | 99% |
| Lombardia | 12.760 | 12.393 | 97% |
| Marche | 2.226 | 2.108 | 95% |
| Molise | 457 | 468 | 102% |
| Piemonte | 4.348 | 4.300 | 99% |
| Puglia | 3.082 | 2.982 | 97% |
| Sardegna | 2.024 | 1.857 | 92% |
| Sicilia | 5.347 | 5.346 | 100% |
| Toscana | 4.462 | 4.528 | 101% |
| Trentino-Alto Adige | 1.434 | 1.142 | 80% |
| Umbria | 813 | 833 | 102% |
| Valle d’Aosta | 175 | 177 | 101% |
| Veneto | 4.869 | 4.268 | 88% |
| TOTAL | 67.485 | 65.762 | 97% |
Abruzzo
Rapporto tra richieste di prelievo ricevute e richieste evase: 78%
Richieste di prelievo ricevute: 493
Richieste di prelievo evase: 383
Dati aggiornati al 30 aprile 2024
Basilicata
Rapporto tra richieste di prelievo ricevute e richieste evase: 57%
Richieste di prelievo ricevute: 152
Richieste di prelievo evase: 86
Dati aggiornati al 30 aprile 2024
Calabria
Rapporto tra richieste di prelievo ricevute e richieste evase: 68%
Richieste di prelievo ricevute: 355
Richieste di prelievo evase: 243
Dati aggiornati al 30 aprile 2024
Campania
Rapporto tra richieste di prelievo ricevute e richieste evase: 96%
Richieste di prelievo ricevute: 1.423
Richieste di prelievo evase: 1.371
Dati aggiornati al 30 aprile 2024
Emilia-Romagna
Rapporto tra richieste di prelievo ricevute e richieste evase :86%
Richieste di prelievo ricevute: 1.152
Richieste di prelievo evase: 994
Dati aggiornati al 30 aprile 2024
Friuli-Venezia Giulia
Rapporto tra richieste di prelievo ricevute e richieste evase: 86%
Richieste di prelievo ricevute: 209
Richieste di prelievo evase: 179
Dati aggiornati al 30 aprile 2024
Lazio
Rapporto tra richieste di prelievo ricevute e richieste evase: 93%
Richieste di prelievo ricevute: 2.296
Richieste di prelievo evase: 2.141
Dati aggiornati al 30 aprile 2024
Liguria
Rapporto tra richieste di prelievo ricevute e richieste evase: 100%
Richieste di prelievo ricevute: 735
Richieste di prelievo evase: 738
Dati aggiornati al 30 aprile 2024
Lombardia
Rapporto tra richieste di prelievo ricevute e richieste evase: 91%
Richieste di prelievo ricevute: 2.693
Richieste di prelievo evase: 2.451
Dati aggiornati al 30 aprile 2024
Marche
Rapporto tra richieste di prelievo ricevute e richieste evase: 84%
Richieste di prelievo ricevute: 510
Richieste di prelievo evase: 430
Dati aggiornati al 30 aprile 2024
Molise
Rapporto tra richieste di prelievo ricevute e richieste evase: 97%
Richieste di prelievo ricevute: 119
Richieste di prelievo evase: 116
Dati aggiornati al 30 aprile 2024
Piemonte
Rapporto tra richieste di prelievo ricevute e richieste evase: 106%
Richieste di prelievo ricevute: 1.215
Richieste di prelievo evase: 1.289
Dati aggiornati al 30 aprile 2024
Puglia
Rapporto tra richieste di prelievo ricevute e richieste evase: 90%
Richieste di prelievo ricevute: 961
Richieste di prelievo evase: 863
Dati aggiornati al 30 aprile 2024
Sardegna
Rapporto tra richieste di prelievo ricevute e richieste evase: 79%
Richieste di prelievo ricevute: 424
Richieste di prelievo evase: 333
Dati aggiornati al 30 aprile 2024
Sicilia
Rapporto tra richieste di prelievo ricevute e richieste evase: 95%
Richieste di prelievo ricevute: 2.275
Richieste di prelievo evase: 2.172
Dati aggiornati al 30 aprile 2024
Toscana
Rapporto tra richieste di prelievo ricevute e richieste evase: 88%
Richieste di prelievo ricevute: 1.226
Richieste di prelievo evase: 1.074
Dati aggiornati al 30 aprile 2024
Trentino-Alto Adige
Rapporto tra richieste di prelievo ricevute e richieste evase: 76%
Richieste di prelievo ricevute: 316
Richieste di prelievo evase: 241
Dati aggiornati al 30 aprile 2024
Umbria
Rapporto tra richieste di prelievo ricevute e richieste evase: 88%
Richieste di prelievo ricevute: 179
Richieste di prelievo evase: 157
Dati aggiornati al 30 aprile 2024
Valle d’Aosta
Rapporto tra richieste di prelievo ricevute e richieste evase: 115%
Richieste di prelievo ricevute: 20
Richieste di prelievo evase: 23
Dati aggiornati al 30 aprile 2024
Veneto
Rapporto tra richieste di prelievo ricevute e richieste evase: 75%
Richieste di prelievo ricevute: 1.447
Richieste di prelievo evase: 1.091
Dati aggiornati al 30 aprile 2024
 Collect ELT